Market Intelligence & Stats
Central Alberta Real Estate Market Intelligence
Live macro & micro data across Red Deer, Sylvan Lake, Lacombe, and surrounding Central Alberta communities.
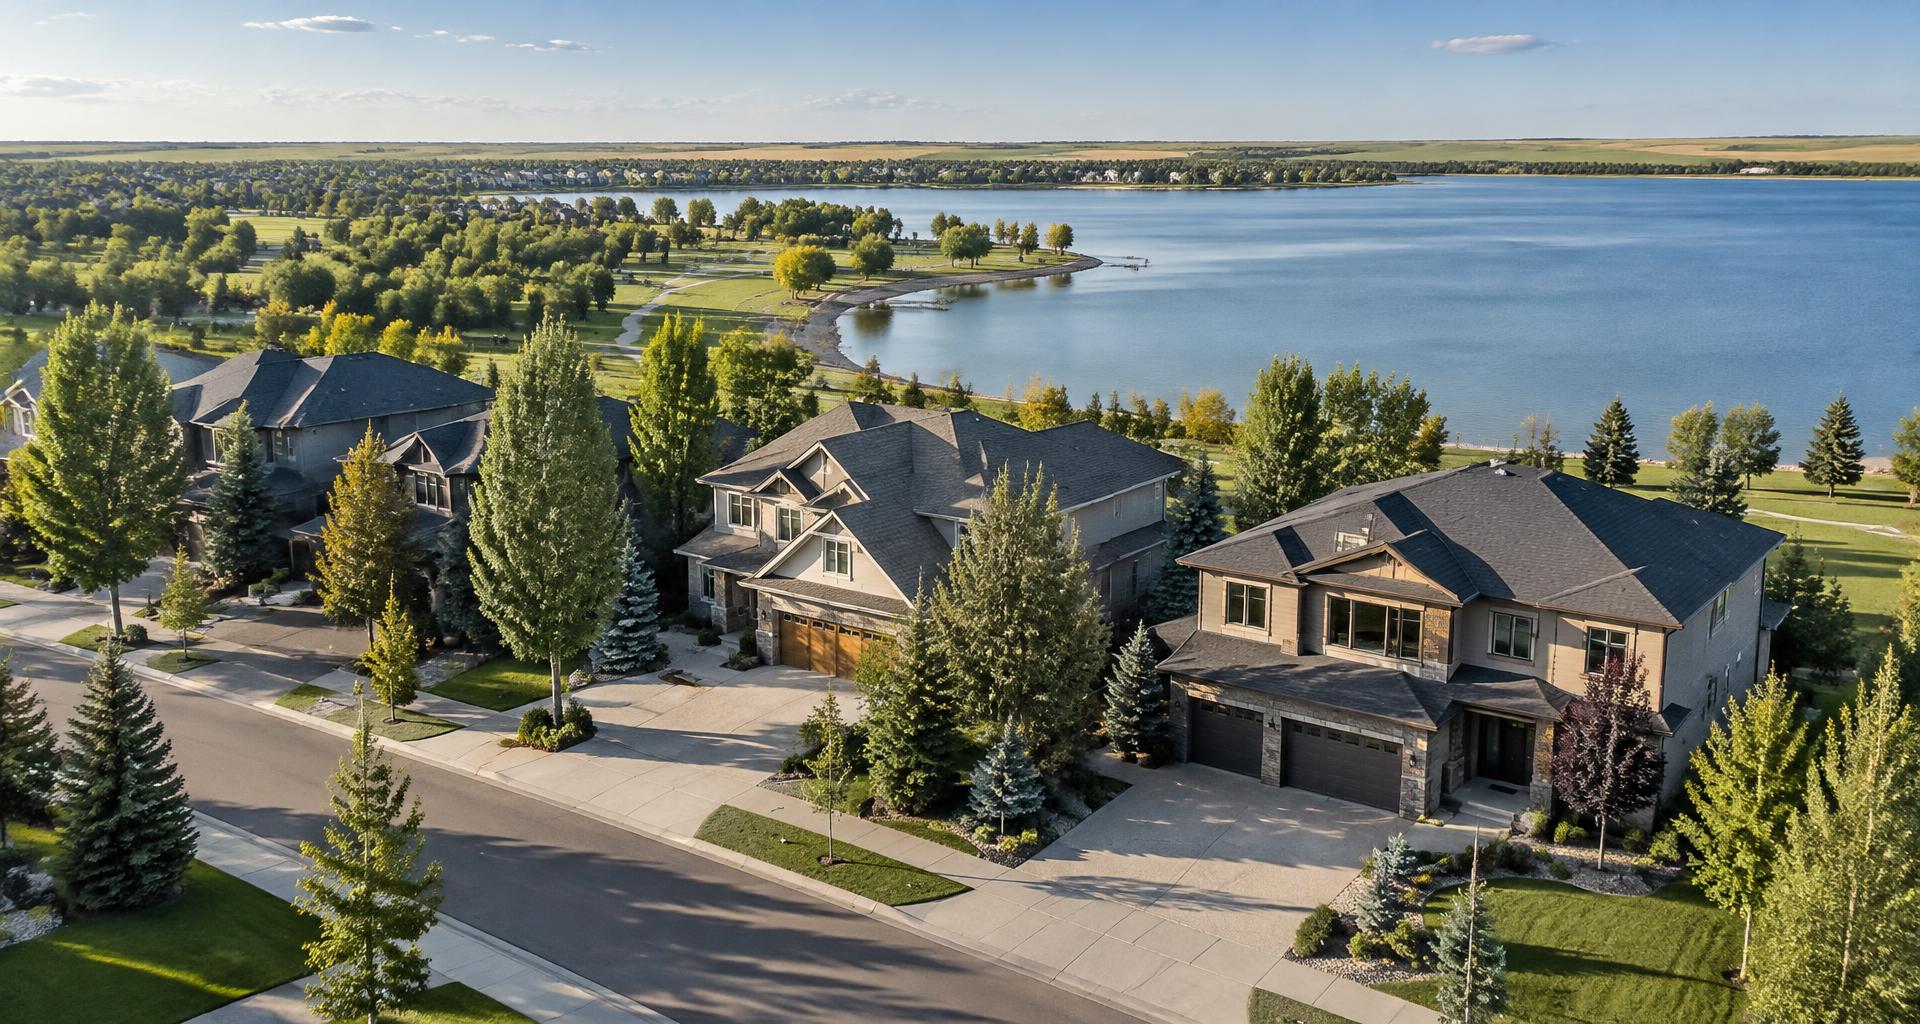
Key statistics for Central Alberta
Estimated figures. Verified monthly stats appear here once published.
Benchmark Price
$406,922
+6.4% YoY
Active Inventory
1,126
-6% YoY
Months of Supply
2
Seller's Market
Avg Days on Market
36 Days
vs. 36 last year
Median Sales Price Vs. Active Listings
Median PriceActive Listings
Market Temperature
Based on 2 months of supply in Central Alberta
Seller’s Market
Buyer’sBalancedSeller’s
Homes are moving fast and multiple offers are common, so buyers should come pre-approved and ready.
Sale-To-List Ratio
102.6%
Homes selling over asking
Absorption Rate
50.1%
Of inventory sold each month
New Listings
654
Added this month
Sales-To-New-Listings
86%
Seller-leaning
Monthly Sales Volume
Homes sold each month
Days On Market Trend
Average days from listing to sale
Prices By Home Type
Central Alberta, latest month
Detached
$454,731
+7.1% YoY
62% of sales · 36 days
Townhouse
$300,983
+7.5% YoY
16% of sales · 36 days
Condo
$224,109
+7.9% YoY
14% of sales · 36 days
Acreage
$669,169
+6.8% YoY
8% of sales · 36 days
Neighbourhood Leaderboards
Tap a neighbourhood to load its stats across Central Alberta
Fastest Growing
Best Value
Most Premium
Municipality Comparison
Tap A Town To Explore| Municipality | Benchmark Price | Monthly Sales | Months of Inventory | YoY Change |
|---|---|---|---|---|
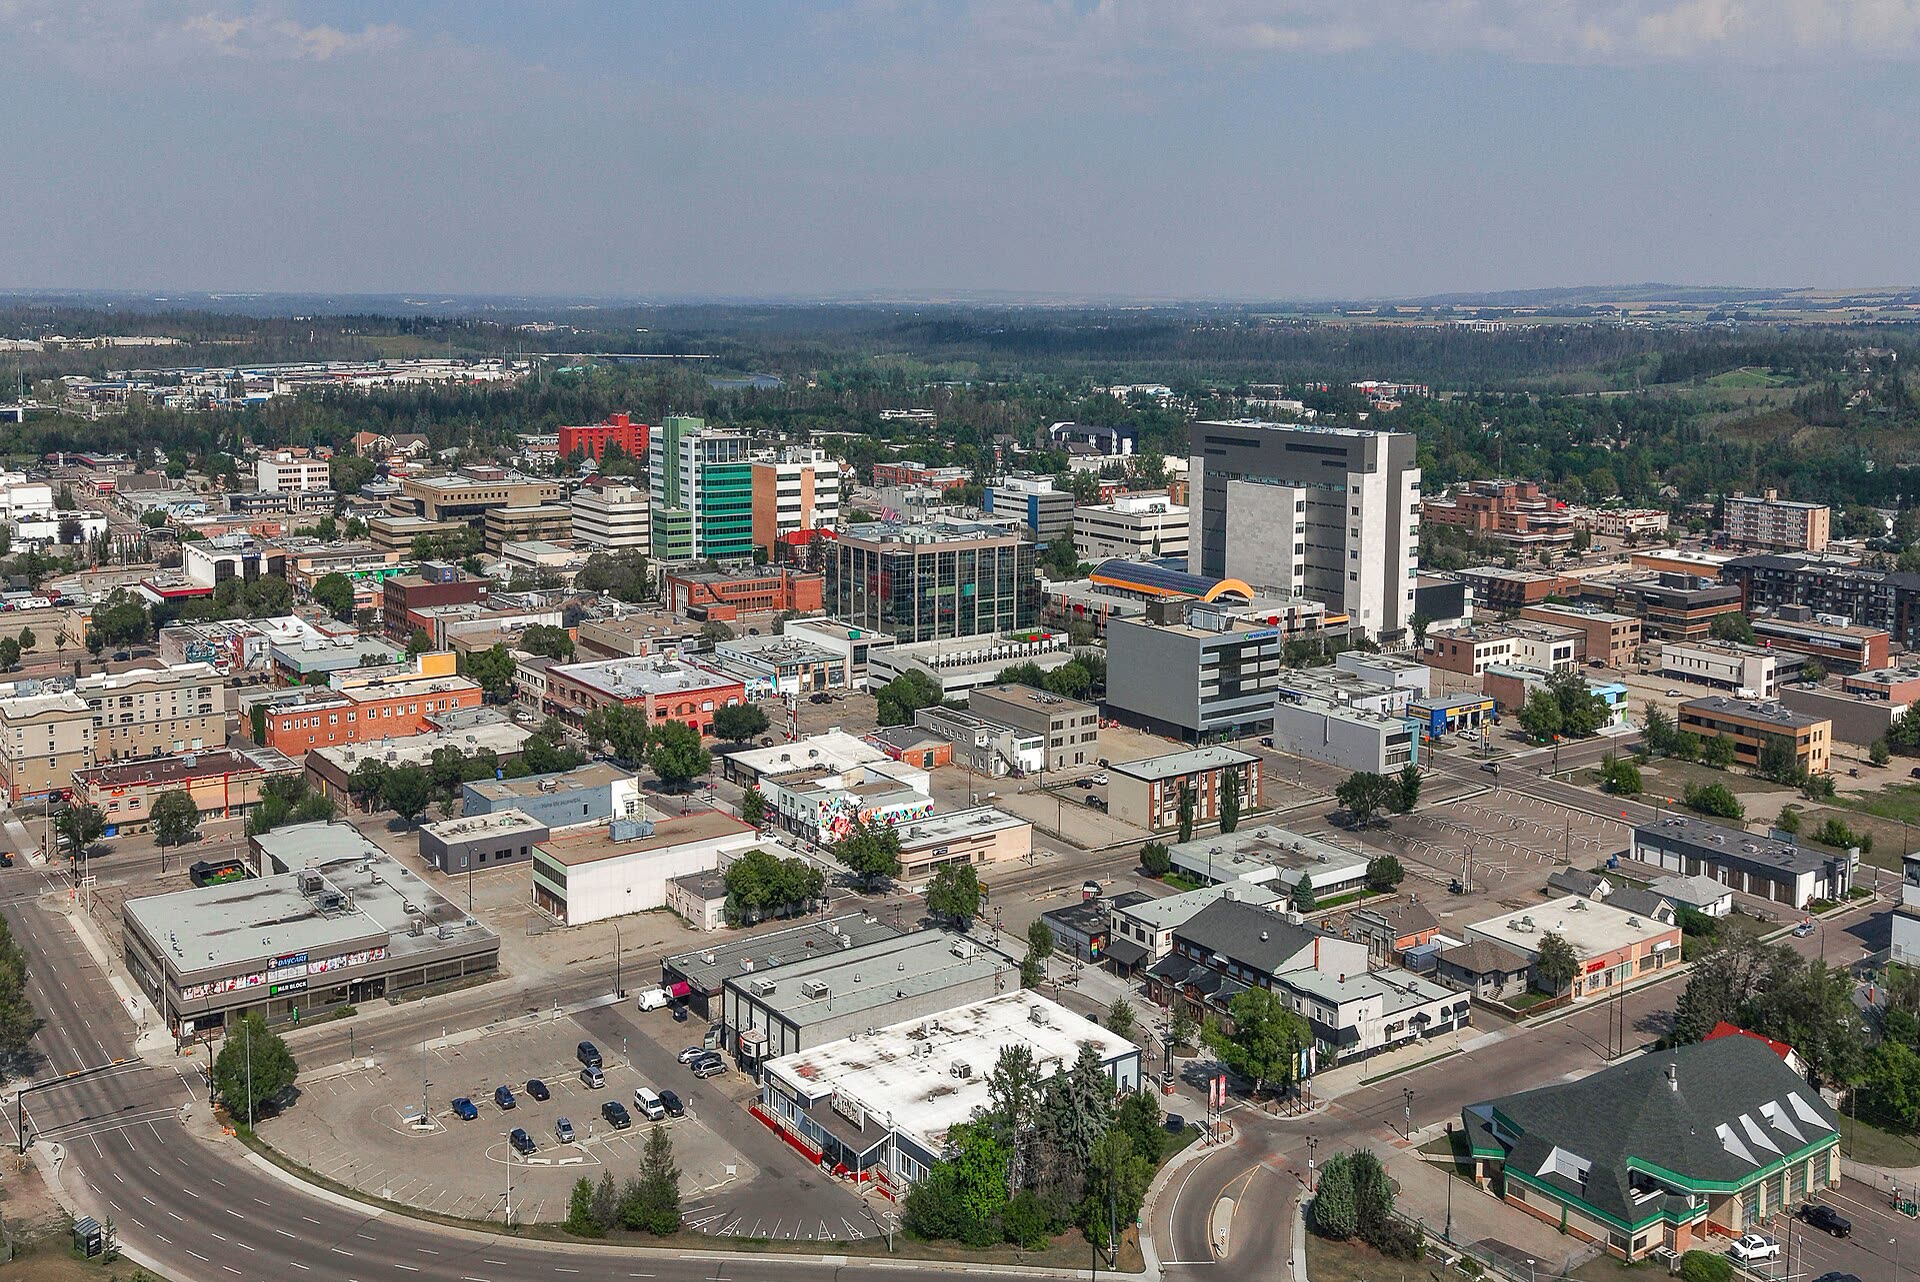 Red Deer | $412,000 | 567 | 1.9 | +6.8% |
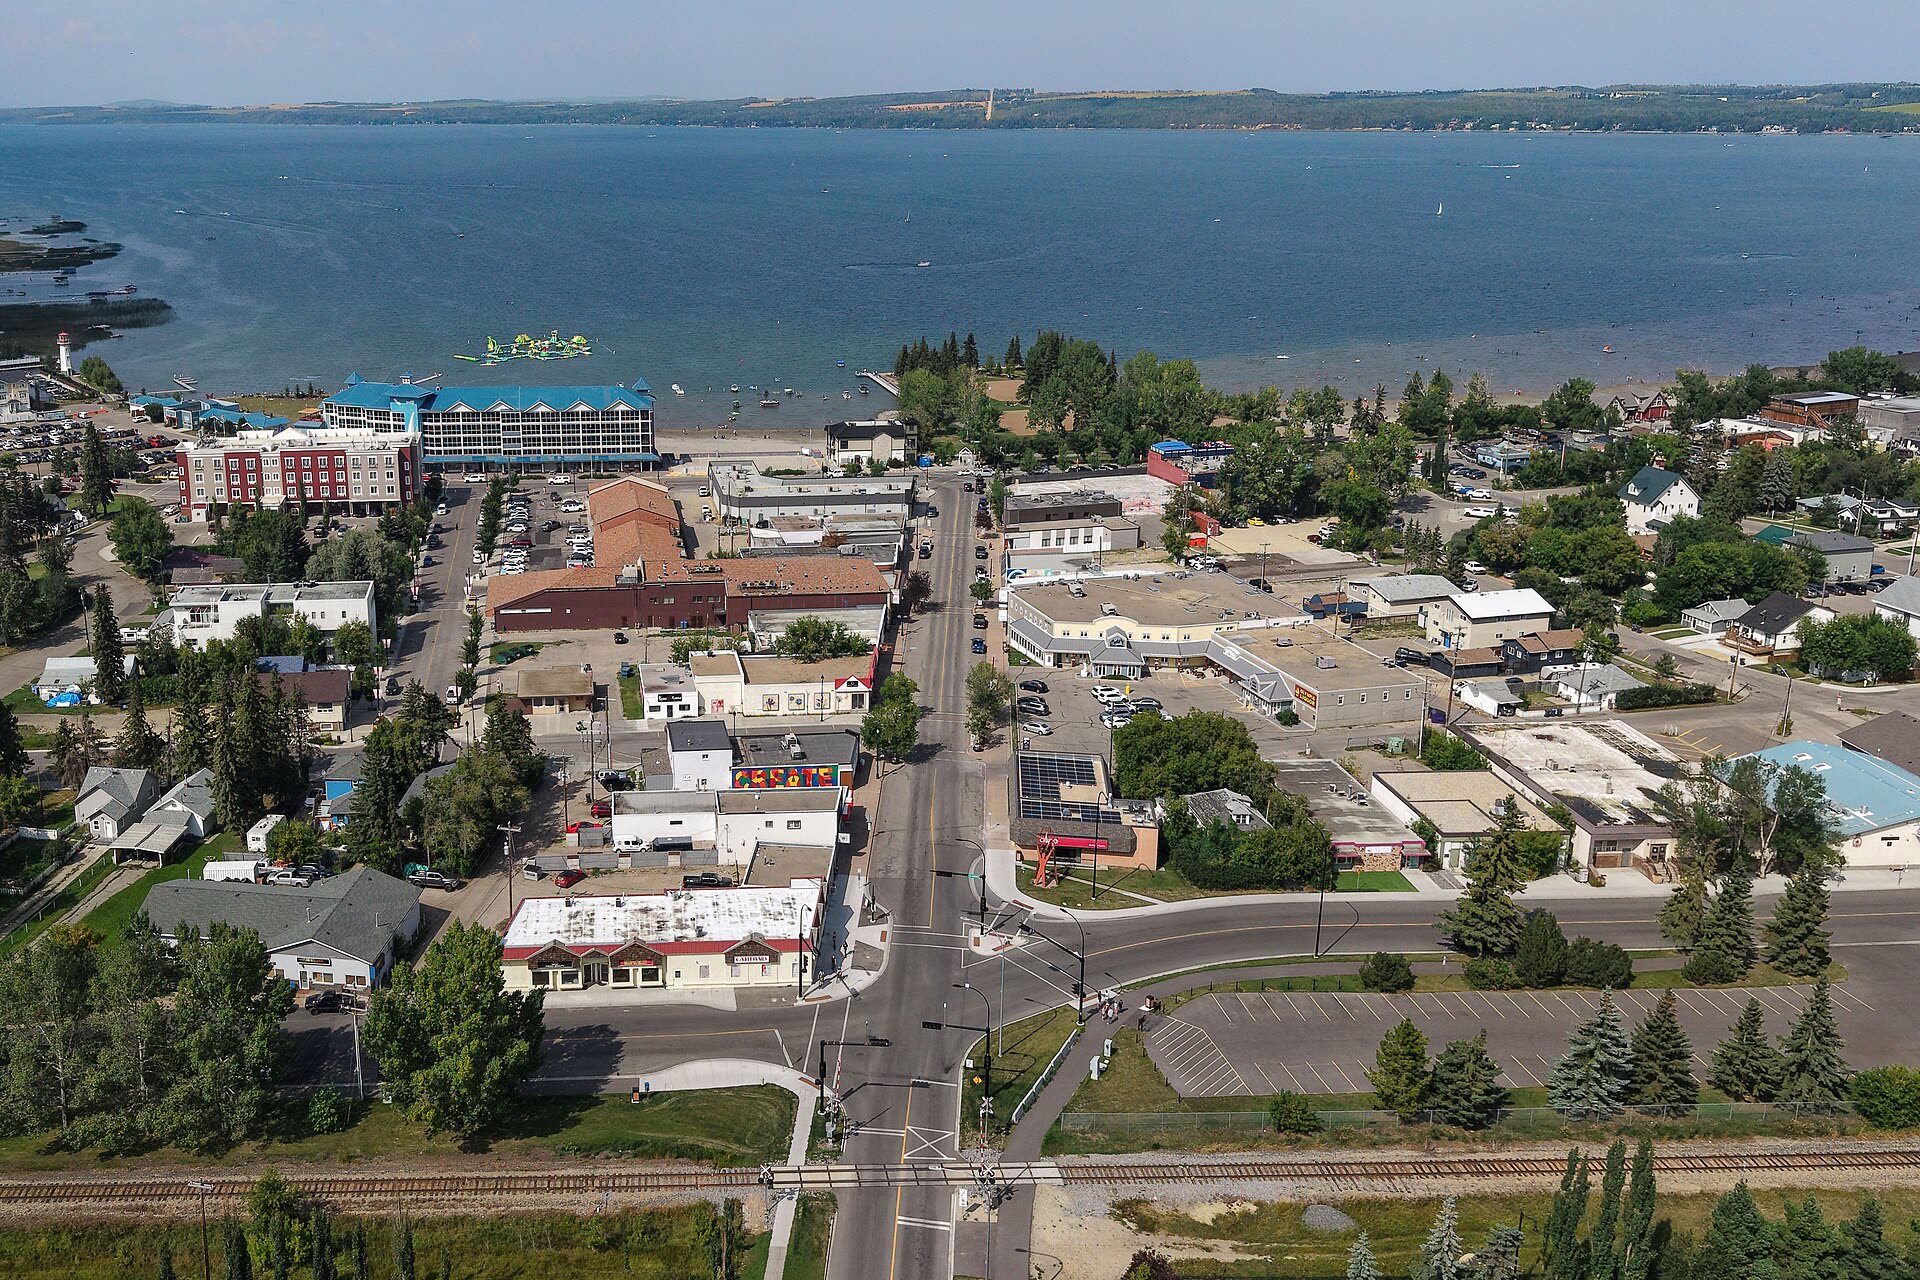 Sylvan Lake | $468,000 | 99 | 1.6 | +8.2% |
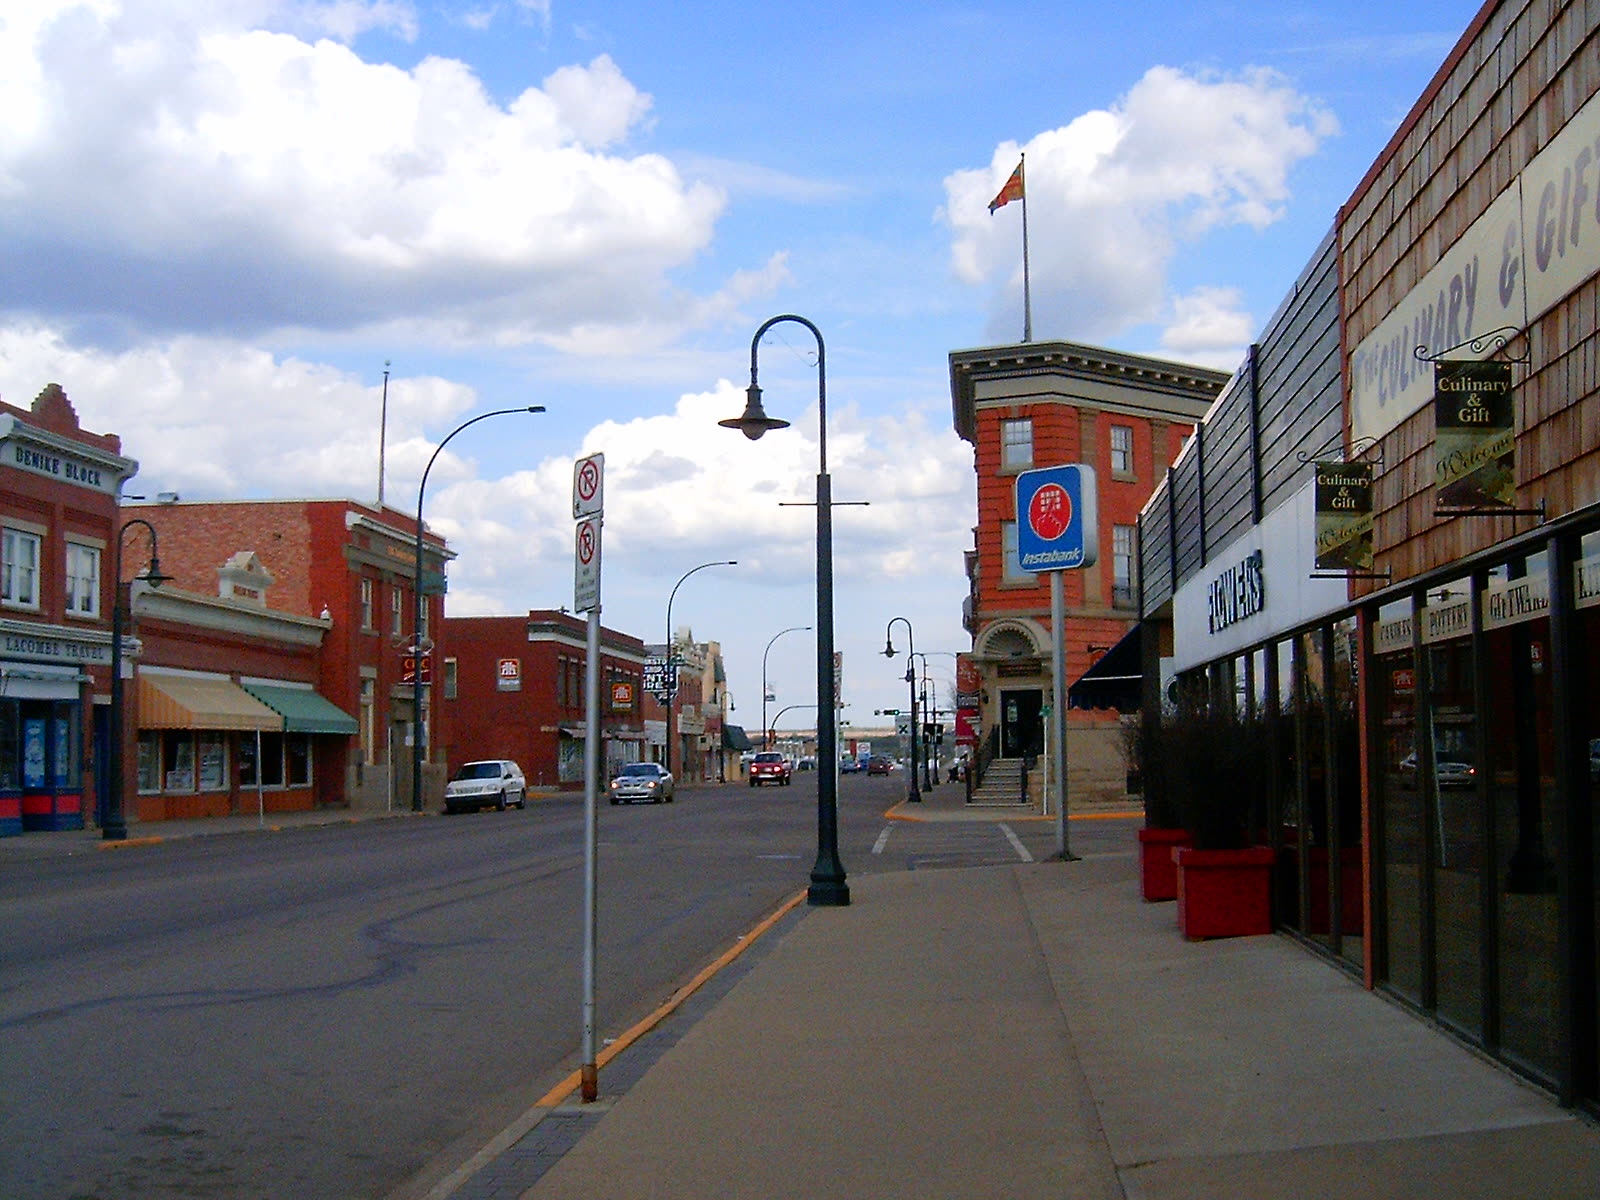 Lacombe | $389,000 | 71 | 2.3 | +5.1% |
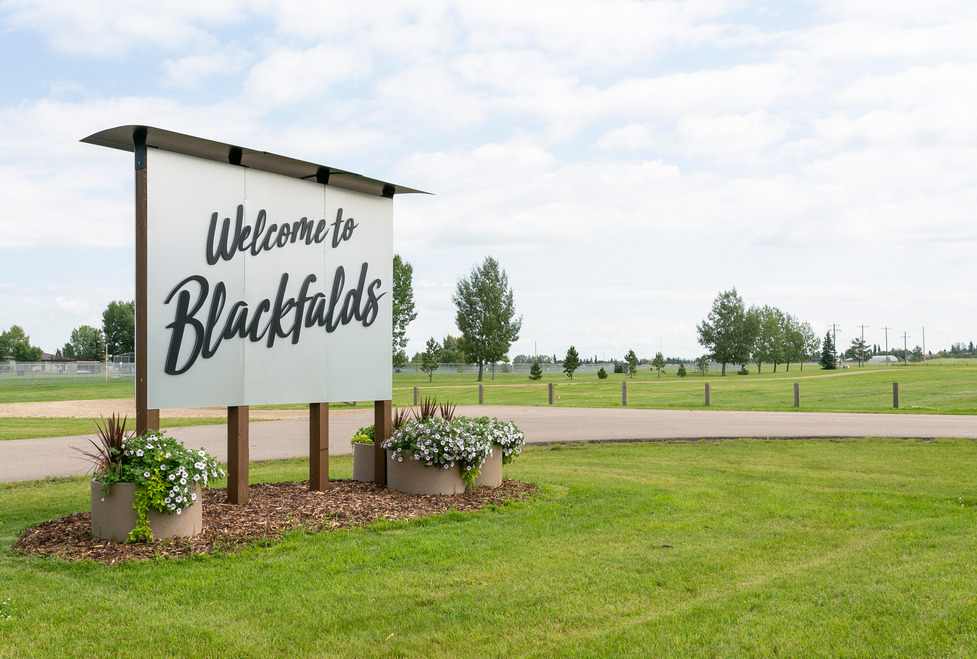 Blackfalds | $398,000 | 59 | 1.8 | +7.4% |
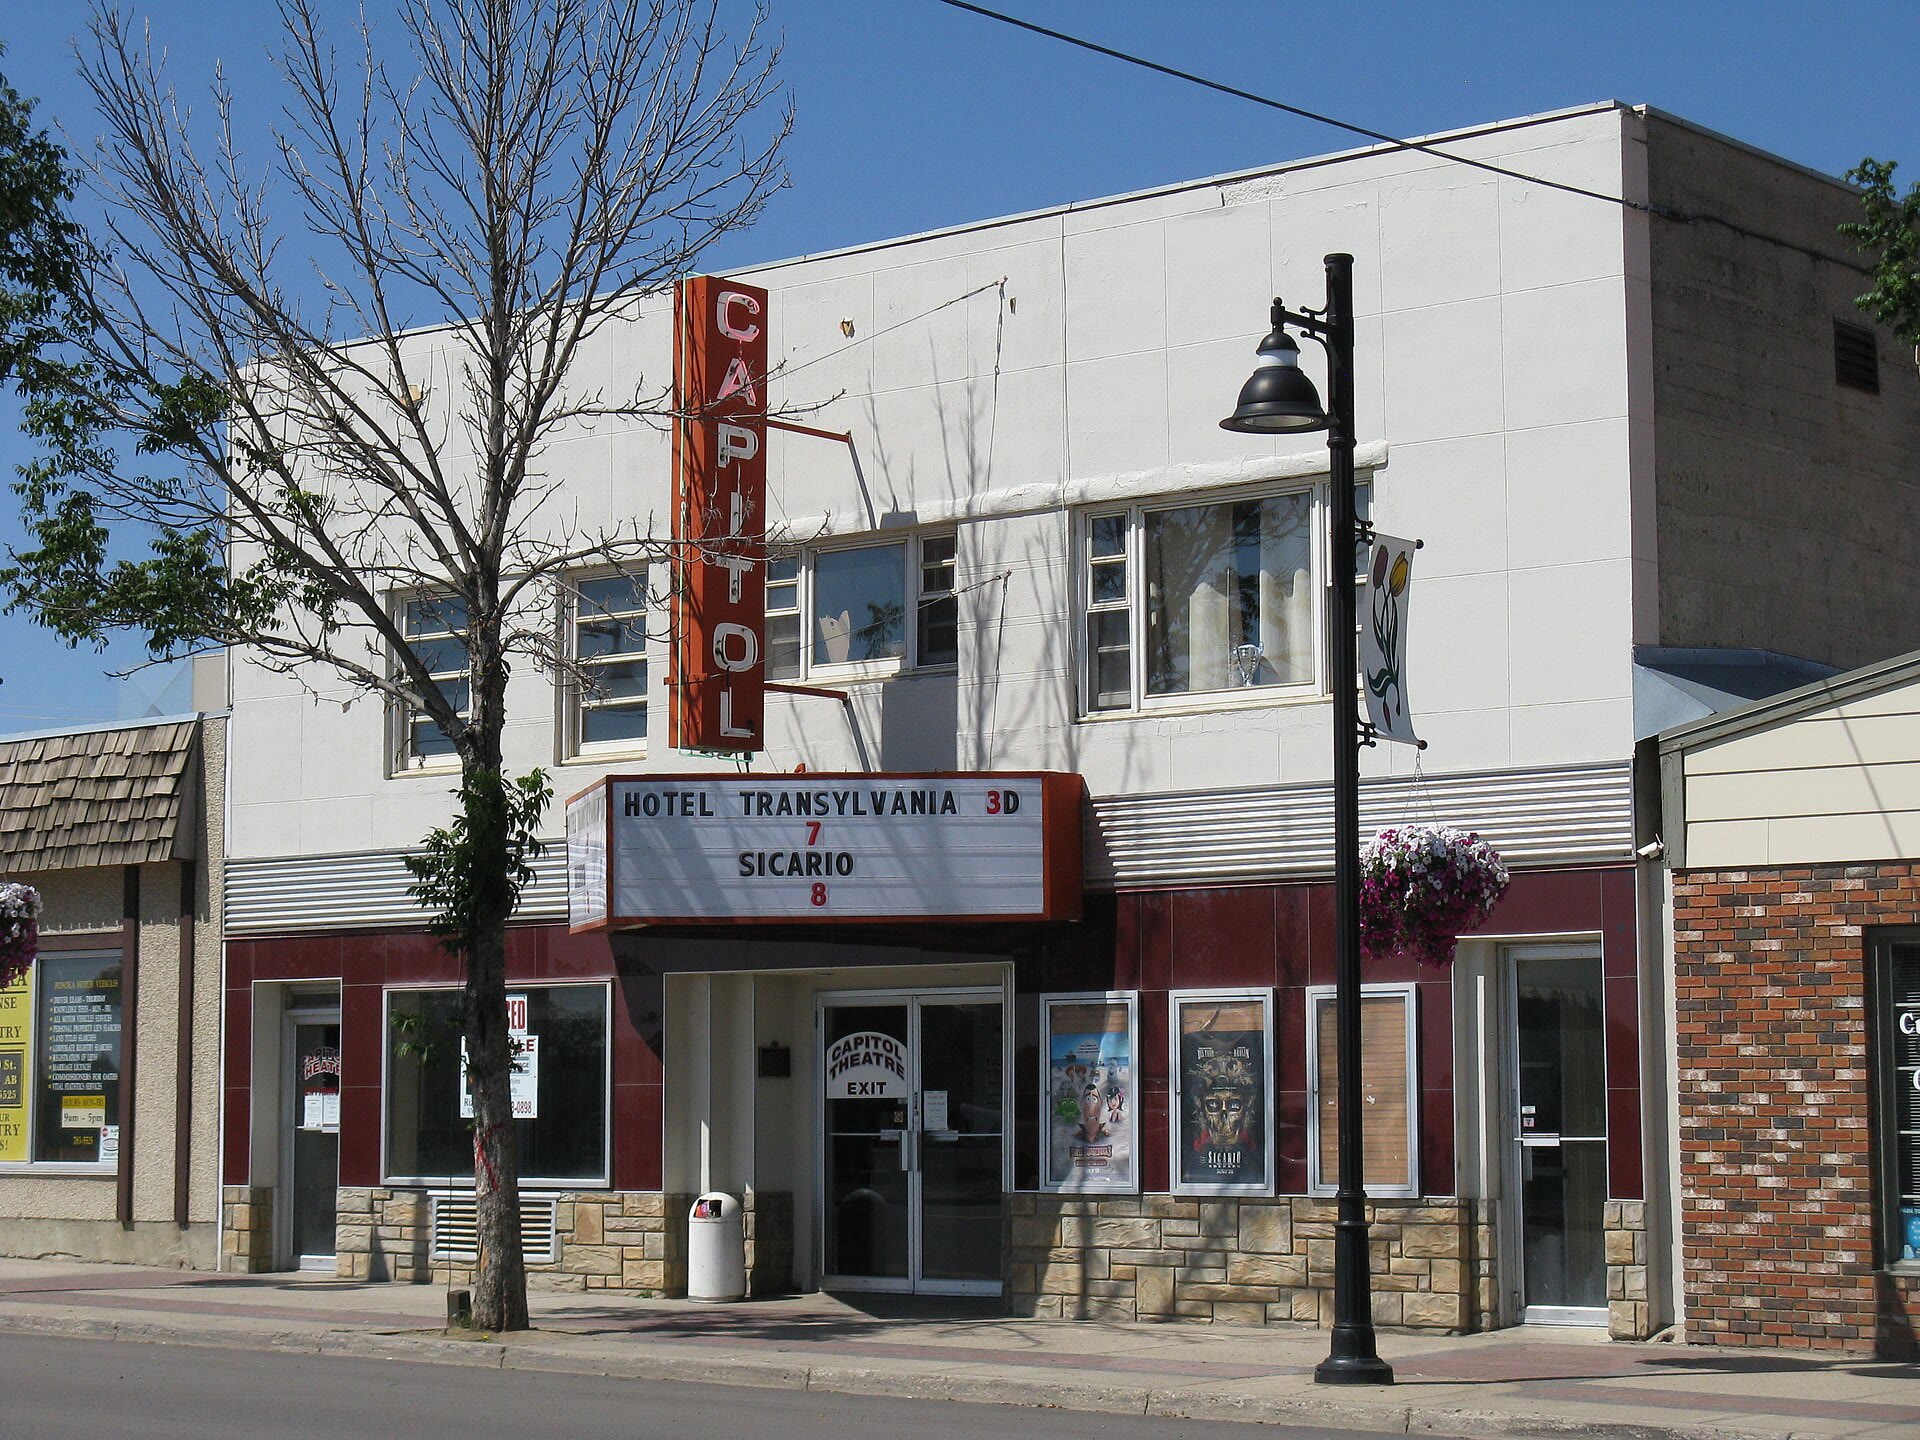 Ponoka | $312,000 | 30 | 2.5 | +4.2% |
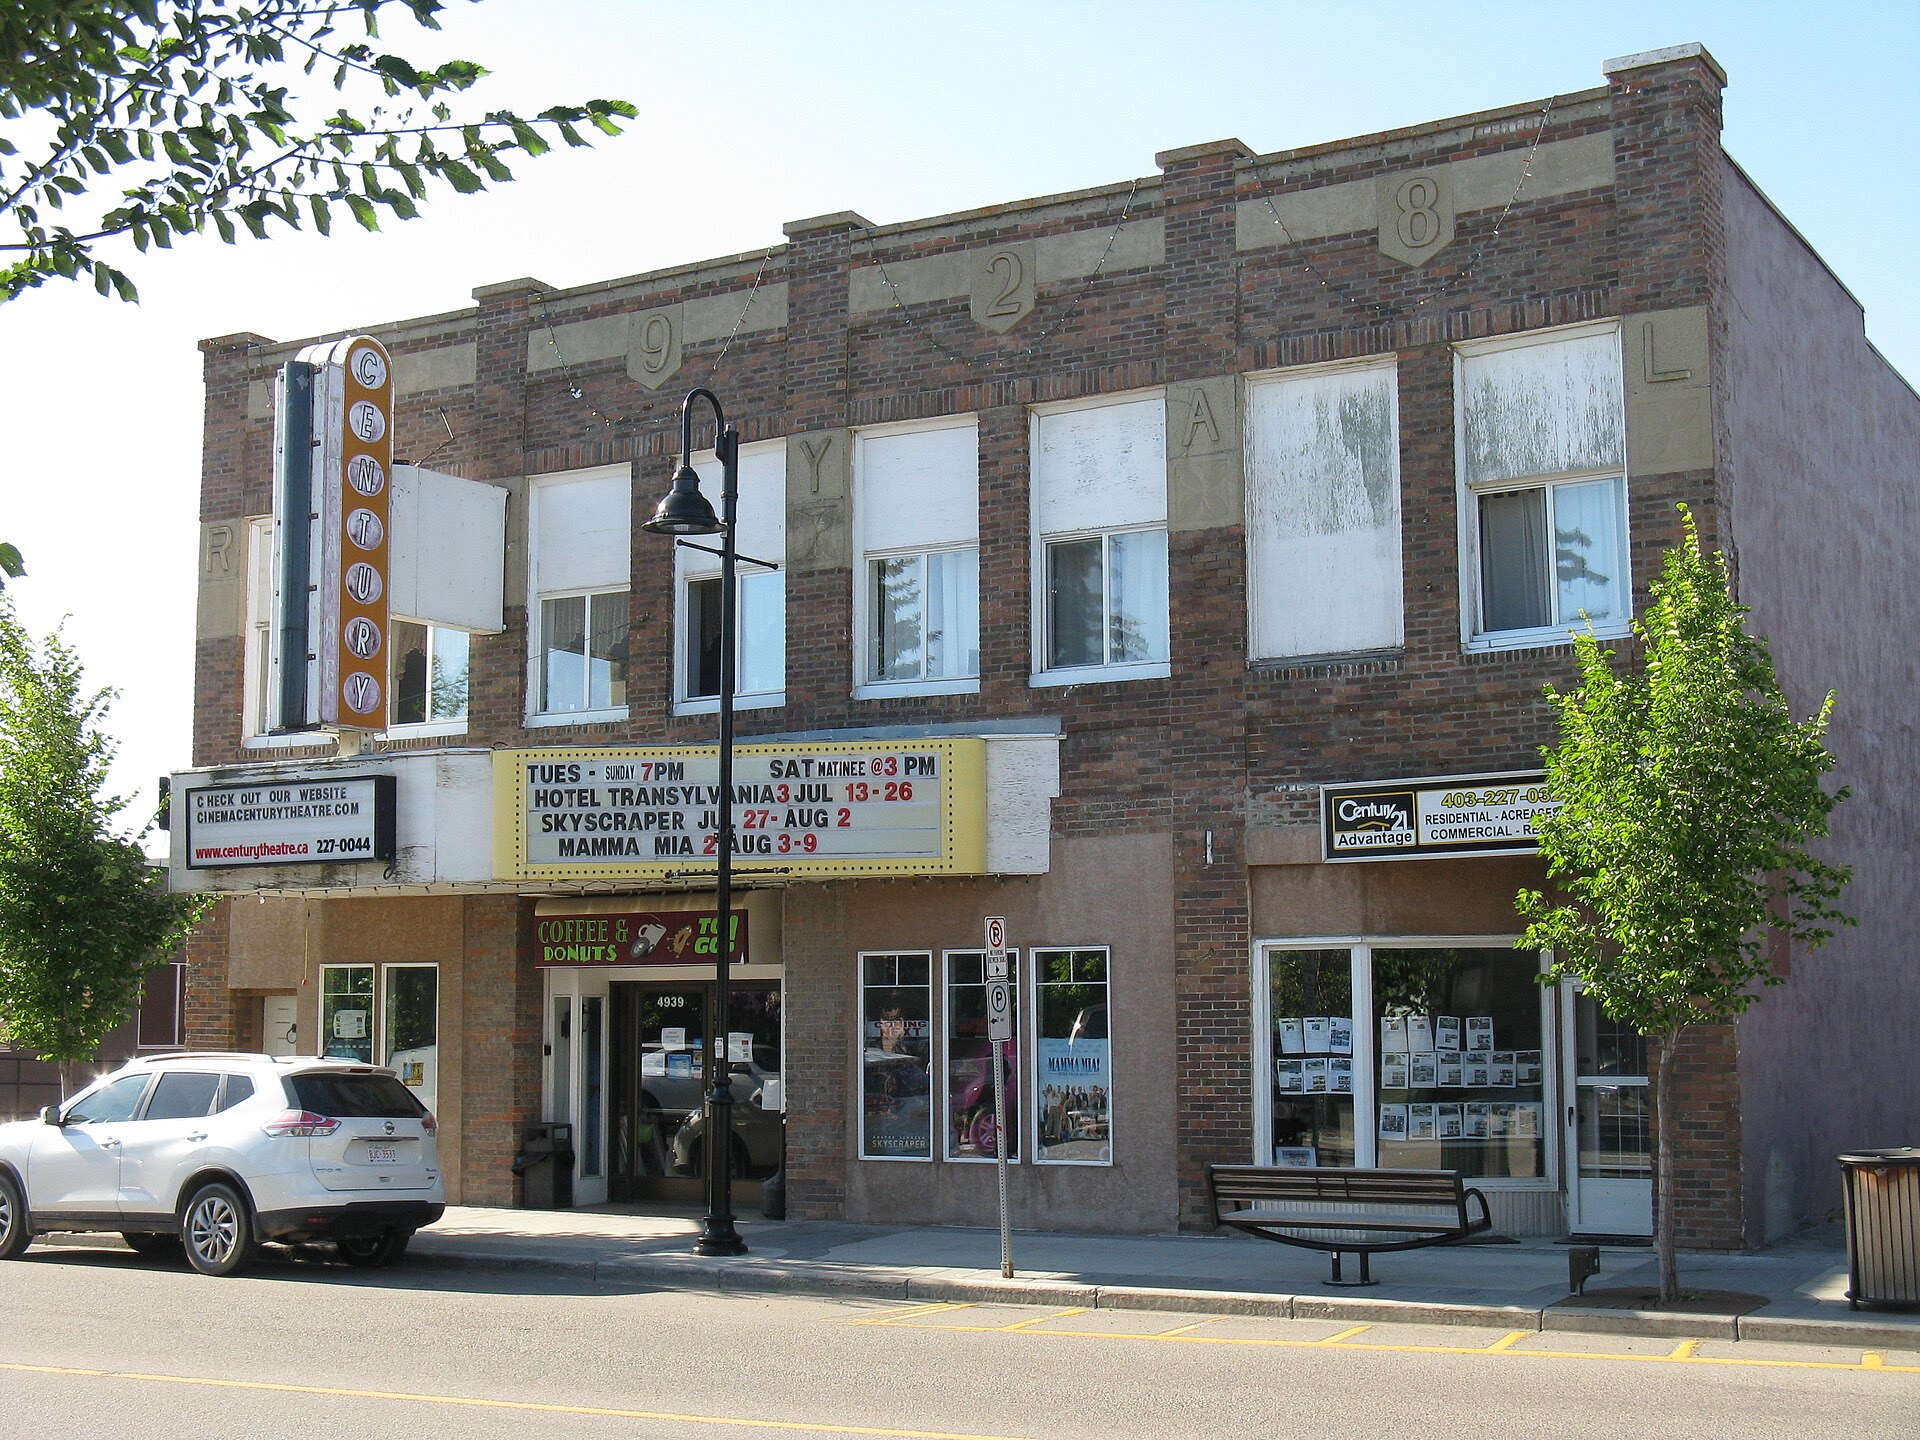 Innisfail | $335,000 | 35 | 2.4 | +4.9% |
Get your home’s value